*Except we won’t be using Vine. The prevalence of explicit adult material on Vine and the lack of privacy controls have led me to look for alternatives, even though I love the simplicity of Vine. We’re using Viddy, which, although not perfect, does a better job with privacy.
Here’s the beauty of the age we live in. We can have students record and edit video in our classrooms with the device in our pocket. This can be done in a matter of minutes! There’s no need to have bulky video cameras, transfer onto a computer, deal with Windows Movie Maker or iMovie, struggle with what file types to save as, etc. etc. Simply an app that lets you record with a little control over some editing techniques.
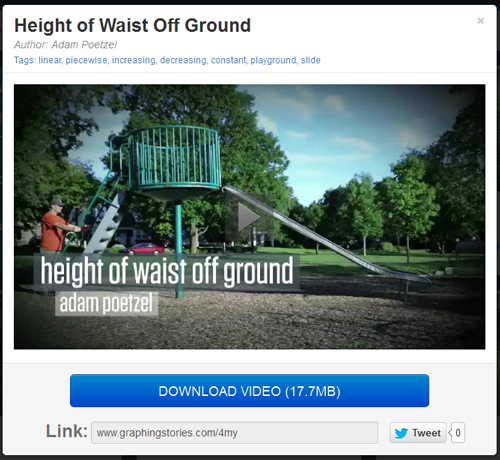
In short: I had students create their own Graphing Stories using iPads (well, iTouches to be exact) and the app Viddy. Yet another shout-out to Dan Meyer’s Graphing Stories. I played several of the Graphing Stories in class and now am heading up the taxonomy to have students actually create their own. Here’s one of my examples from the students:
Although Vine is much simpler to use, it didn’t take much of me playing around with it before realizing it would be too risky in the classroom (as an aside: this is very disappointing. My quick research found articles that alluded to Vine’s pornography problem dating back to January. What a waste of what could be an amazing tool. [2014 UPDATE: Vine has gotten MUCH better in this regard. I use it in class now! But I don’t ask students to obtain the app – either I use it, or they are allowed to use it as a means to record video if that’s an app they already have.] Viddy gets the job done. We had three iTouches available to us and the kids were busy enough with recording that they didn’t get into the notion that they were using a social video app. When you add in making the account private, Viddy almost turns into a video editing app without the pitfalls of public, social sharing.
The ease in which this allows students to create is AMAZING. We get rid of all stuff we used to have to deal with, as described above, and suddenly the time, focus and energy is on the mathematics. Example:
Some of the students wanted to record a group member riding one of those wheely scooters down a ramp. They wanted to graph the person’s height off the ground. But wait! What would that graph look like? Of course, it would be constant if they are referring to height off the floor, but decreasing if they are talking elevation. That conversation happened in my class. That is deep mathematical thought in an Algebra I classroom.
This is some exciting stuff.
Below is the project handout. Each group was required to story-board their videos before they started shooting. This actually helped with the notion of step functions greatly, in addition to streamlining the logistics of shooting video. To sum it up: It was an amazing project and easily the best thing I’ve pulled off this year. I hope it sparks some ideas out there in the MathTwitterBlogoSphere.


You must be logged in to post a comment.