8th Grade Calculus

graphThere’s a blog post from Reflections in the Why out there in which the blogger asks “Which graph best represents the importance of teacher knowledge of mathematical content as a function of grade level taught?”  

At the time (a year ago) I answered graph E.  My reasoning:

The more I learn about high school math (second year teacher, now teaching Alg I, Alg II, Pre-Calc), the more I realize how nuanced upper level topics are. I sat in on a Calculus class and was blown away at the difficulty of it (coming from a math major!) – we’re not just cranking out derivatives here. While TEACHING each grade level requires specific knowledge of HOW students learn each topic, I think the complexity of the math itself increases. Probably not exponentially, but faster than linearly.

Now in my third year, I think I’m pretty much in the same place.  I’d like to move that initial value in (E) way up though.

Of course, in a perfect world we’re all 4.0 math majors from highly reputable universities, no matter what level we teach.  We all aced our Analysis/Theory of Calculus class (HA!) and can drop some sigma-epsilon proofs on 3rd graders if necessary.

Okay, maybe not.

CALCHowever, it’s still crucial we have that background.  Because, then when you’re teaching 8th grade algebra and introduce slope, you can ask the question:

What is the slope right now?  What is the speed right now?

You can reinforce the idea of average speed over a period of time vs. instantaneous speed at an instance.  And you can then expect students to understand slope as an average rate of change, especially when you’re looking at data and lines of best fit and not the pretty, everything-works-out-to-a-round-integer-answer examples in the text book.

This was one of my more fun discussions of the year.  Sure it was probably over the head of a third of the class.  That’s okay.  I’m sure even those that weren’t ready for it could see that we needed two points to calculate slope and this magical calculus I spoke of let us get slope with one point.  Now, I’m primarily an 9-12 math teacher that teaches an 8th grade class.  However, it is so, so important that any math teacher, in any grade, can make that calculus connection to rate-of-change, even if they’ve left behind the chain rule and related rates years ago.

Zombies and Math: There are no coincidences!

This is my intro to exponential functions in algebra 2:

zombie-exponentialThe Walking Dead is still a smash hit.  Today, we got to solving logarithmic functions and we went back to that final question (which I purposefully left hanging back at the beginning) and solved it algebraically…

28days

And when you solve that function for x… Oh.. Oh dear God, it can’t be….

28 days!!!

As in the zombie movie 28 Days Later!!!

Math.  Zombies.  It’s all connected.  It all makes sense.  The Zombie apocalypse is coming, and math may be our only hope.

Fun on the First Day Back

I’ve decided to do something new for the first day back after break.  Instead of doing the typical “hand back the exam, go over the difficult questions,” I’ve decided to shake things up.

For my algebra 1 and algebra 2 classes, I’m going to follow the following game plan for the first days back.

  • Brain CRUSHER (30 minutes)
  • Hand back exams so students can go over (10 min)
  • “Exam Redux” homework

Nowhere in there will I “go over” an exam problem on the board.  Instead, the problems I think we need to review will be built into homework.

My main goal is to build in a fun, inquisitive and engaging return to math class without having to hold the students accountable to much aside from thinking about a perplexing topic.

For algebra 1, I’ll give the “1=2” proof.  One of my greatest life regrets was not taking a picture of this proof when I saw it written on the bathroom stall in the math department building in college.  Oh, what could have been 🙂

     a = x            [true for some a's and x's]
   a+a = a+x          [add a to both sides]
    2a = a+x          [a+a = 2a]
 2a-2x = a+x-2x       [subtract 2x from both sides]
2(a-x) = a+x-2x       [2a-2x = 2(a-x)]
2(a-x) = a-x          [x-2x = -x]
     2 = 1            [divide both sides by a-x]

For algebra 2, I’ll pose a simpler question but one I expect to produce some interesting discussion:

0.9999999999999999… = 1

True of false?

I’ll be able to finish this discussion by showing Vi Hart’s video, too!

Much better than your normal “lets go over exam questions,” don’t you think?  Any other good brainteasers/perplexing “math only” questions?  By math only, I’m meaning just purely mathematical questions.  I’ve been inspired by Dan’s post on engaging fake world math and am looking for ways to inject more of it into my classes.

Graphing Stories and Vine*: A Match Made in Heaven

*Except we won’t be using Vine.  The prevalence of explicit adult material on Vine and the lack of privacy controls have led me to look for alternatives, even though I love the simplicity of Vine.  We’re using Viddy, which, although not perfect, does a better job with privacy.

Here’s the beauty of the age we live in.  We can have students record and edit video in our classrooms with the device in our pocket.  This can be done in a matter of minutes!  There’s no need to have bulky video cameras, transfer onto a computer, deal with Windows Movie Maker or iMovie, struggle with what file types to save as, etc. etc.  Simply an app that lets you record with a little control over some editing techniques.

In short: I had students create their own Graphing Stories using iPads (well, iTouches to be exact) and the app Viddy.  Yet another shout-out to Dan Meyer’s Graphing Stories.  I played several of the Graphing Stories in class and now am heading up the taxonomy to have students actually create their own.  Here’s one of my examples from the students:

Although Vine is much simpler to use, it didn’t take much of me playing around with it before realizing it would be too risky in the classroom (as an aside: this is very disappointing.  My quick research found articles that alluded to Vine’s pornography problem dating back to January.  What a waste of what could be an amazing tool.  [2014 UPDATE:  Vine has gotten MUCH better in this regard.  I use it in class now!  But I don’t ask students to obtain the app – either I use it, or they are allowed to use it as a means to record video if that’s an app they already have.]  Viddy gets the job done.  We had three iTouches available to us and the kids were busy enough with recording that they didn’t get into the notion that they were using a social video app.  When you add in making the account private, Viddy almost turns into a video editing app without the pitfalls of public, social sharing.

The ease in which this allows students to create is AMAZING.  We get rid of all stuff we used to have to deal with, as described above, and suddenly the time, focus and energy is on the mathematics.  Example:

Some of the students wanted to record a group member riding one of those wheely scooters down a ramp.  They wanted to graph the person’s height off the ground.  But wait!  What would that graph look like?  Of course, it would be constant if they are referring to height off the floor, but decreasing if they are talking elevation.  That conversation happened in my class.  That is deep mathematical thought in an Algebra I classroom.

This is some exciting stuff.

Below is the project handout.  Each group was required to story-board their videos before they started shooting.  This actually helped with the notion of step functions greatly, in addition to streamlining the logistics of shooting video.  To sum it up: It was an amazing project and easily the best thing I’ve pulled off this year.  I hope it sparks some ideas out there in the MathTwitterBlogoSphere.

GraphingStories.com: Two Book Sections in 40 Minutes

Obligatory apology for rarity in posting goes here.  The end of the soccer season finally allowed me to breath… for a day.  Basketball workouts started almost immediately and I am still juggling 4 preps.  The juggling has eased up a bit – my 8th grade computers class is a quarter-long class that has started the second rotation.  That’s lightened my prep load, though just a bit.

For our standard “Algebra II” class, we use Discovering Advanced Algebra by Murdoch, Kamischke and Kamischke.  I love this book.  After a year of getting used to it and finding all the subtleties in the way the material is presented, I feel like I’m making almost all of those little connections.

The fourth chapter is on functions, transformations and the basic families of functions.  The first section of the chapter is basically this:

4.1 Interpreting Graphs
– Graphing a story
– Relationship between an independent and dependent variable
– Identifying features of graphs by describing the above relationship

Instead of writing a bunch of vocab words on the board and doing “math book” problems (after 8 seconds, how high is the balloon?), I simply showed about 5 graphing stories:

Just a picture... Click to head over to the amazing GraphingStories.com

Just a picture… Click to head over to the amazing GraphingStories.com

That was it.  That was the entire section.  I then spent 20 minutes discussing function notation and 5 minutes doing if “f(x) = 2x-4, then f(3) = ?” skill practice.

Bam.  We delved deep into the major concept of a function and truly examined the relationship between an independent and dependent variable all in one class period.

Two closing thoughts:

1.  This is one of the amazing results of Dan Meyer’s decision to take the “Graph a Story” textbook problem and put it on video.  (Though the overlaying of the graph on the video is crucial as well).

2. What other concepts do textbooks take days to develop using the “old fashioned” ways that could be examined deeper and quicker through other media?

Oh hey there, how’s it going? Let’s read “If You Give a Mouse a Cookie”

Yeesh.  Been a while.  Back on the first day of school I started taking notes for what was supposed to be my annual “First Day of School” blog post.  And then the day just kept getting crazier and crazier.  Here’s my day, from a very foggy memory, in neat, numbered-list form:

  1. Copiers explode (or something like that)
  2. All-School assembly
  3. A period (Algebra II)
  4. B period (Foundations of Computer Science)
  5. C period… is missing?  Apparently, they had locker day the first day (8th grade computers)
  6. D period… why are the eighth graders all missing? (Algebra I)
  7. D period… wait, why are the eighth graders at lunch and not in class- oh… oh, dear god no…
  8. D period… 9th grade goes to lunch and…
  9. D period… 8th grade shows up.  I get no lunch 😦
  10. E period (Algebra II)
  11. F period…. PREP!  FINALLY!  I don’t remember for sure, but I’d bet everything that I got out of the building for lunch, even if I had brought my own.
  12. G period…. PREP!  But not really!  We have an away soccer game!
  13. Soccer away game!  We lose! 😥
  14. I get back to the school around 7pm, home by 7:30pm.

Things of note:

I have five classes, four preps this year.  They are the first five periods of the day.  Algebra II (twice), Algebra I, Foundations of Computer Science, 8th grade computers.  The Algebra 1 class is split; half 8th graders and half 9th graders.  This led to the crazy scheduling fluke described above.  Basically, at our school D-period is the lunch period which unfortunately and inadvertently was when this class was scheduled.  Normally, E period is the lunch period, but on some special days, it is bumped to D period.  Basically, I had D period twice and I lost my lunch in the process.  Foundations of Computer Science is a new class to our school.  It’s AP CS lite for now and it is just a semester long class.  The students are learning Java and hopefully the foundational concepts behind all computer programming.  8th grade computers is also a new class to our school.  Students are learning the introductory ideas behind programming.  We’re “coding” in Scratch.  The 8th graders are creating computer games.  This is fun.  It’s a quarter-long (8 week) class that will get repeated 4 times so that each 8th grader in the school takes it.  Our school is one step (AP CS) away from a fully comprehensive, 6-12 computer science curriculum.  This is awesome.  In a time that most schools have cut CS, ours has added it and gone all-in.  This is very awesome.

Coaching a varsity sport during fall semester is tough, even if I’m only an assistant coach.  Soccer’s final regular season week is upon us, however it’s likely we’ll go several games deep into the playoffs, so there’s still a few weeks left.

I am loving teaching algebra II.  I really have nothing that’s all too amazing to add here.  My students are awesome and I’m finally getting the chance to teach a course two years in a row and it is so much fun.

My parent-teachers conferences were da bomb.  I couldn’t fit my head through the door after all my students’ parents told me how much of a baller I was.  Seriously, though, they went so smooth and mostly because we have awesome kids and awesome parents.  I’m very lucky!

The Coolest Thing I’ve Done in the Class So Far

In my 8th grade computer class we took a day, left the classroom, sat in a circle in the hallway and had story time.  The book:

If_You_Give_A_Mouse_A_Cookie

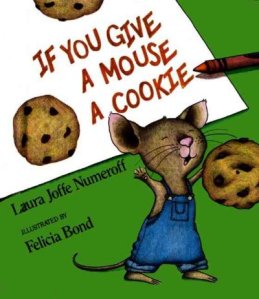
The reasoning behind it was an introduction to control statements: if-thens.  I cannot emphasize this enough:

Teenagers LOVE reading children’s books!

I think it’s a change to look back at how simple things were for them just a few years ago.  They truly enjoy it.  I always start by reading If you give a mouse a cookie.  I don’t tell them why at first.  They love it.  They demand I provide ample time to look at the pictures.  They sit silently, fully attentive, as if this was the most enjoyable thing they’ve done in a classroom in years (and maybe it is, which says…).  I then ask for volunteers to read the other three stories in the series.  This takes about 35 minutes total, leaving time to talk about If-then statements.

This works great for geometry classes, but also it worked very well for my 8th grade CPU class.  I’ll probably bust it out for my Foundations of Computer Science class as well.  I strongly, strongly recommend every math teacher buy the book that has all four stories in it, one of the best purchases I’ve made:

Mouse Cookies and More: A Treasury

It comes with the four original stories and a bunch of songs and recipes that I ignore.  I bought it for $25 at a Barnes and Nobel (before educator discount) but you can get it cheap on Amazon at the link above.

Hope everyone’s first month of school has gone well (and maybe a little less busy than mine!)
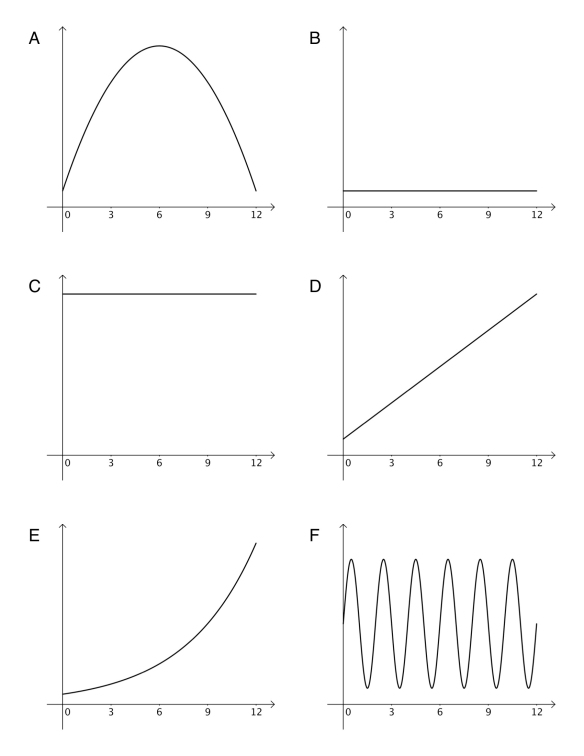
Barbie Bungee and the POWER OF MATH

I’m riding my bike to school a lot in an effort to both save money on gasoline and enjoy the fact that I live just 3.5 miles from school.  The result of this, though, is that I have to be very careful about what I cram into my bag to bring to school.  Long story short: We did Barbie Bungee and not only did I leave my video camera at home, but I also happened to forget my phone.  Sigh.

However, thanks to the fact that we live in 2013 and a ridiculous number of my students have high definition cameras in their pockets, I was able to have a student email me this video, which I edited to slow down.  The video isn’t great, nor upright, but I think it hammers home a significant point:

Like, seriously, how cool is math?  A group modeled the number of rubber bands needed to maximize Barbie’s thrills (but not kills). They were given a height, used their model to predict how long their bungee cord needed to be and look at how amazingly close they got.  Go math.

Quick Note: Holy smokes this is post #99 for this blog.  I guess I need to figure out something special for the next one!

Exponent Properties, As Explained By Star Wars Characters

Knocks it out of the park, my student does:

starwars1starwars2starwars3starwars4starwars5starwars6

Seriously, I am suspending my “over 100% is not a possible grade” rule of thumb.  This was all hand-illustrated and some of the color/sharpness did not survive the scanning/jpg-ifying process.  Plus, the cover page has been omitted to keep the student’s name off the Intertubes. I was totally blown away.

I like my timing of this project: Instead of having a test on the exponent properties, we’re doing a project since half of my class is missing this week to a yearly field trip.  However, despite how amazed I am by this student, I wonder: Can she use all these exponent rules?  On its face, this is an awesome alternative assessment, but am I really assessing my students aptitude with exponent properties?  (Clearly, there are mistakes in there, though more of the mismatching examples variety).  Right now I don’t really care – this is awesome, different, and there’s something to be said for holding students accountable to project specifications (see below) and deadlines in addition to cranking out math problems.  But I will let that thought/worry creep into our future assessments, just to make sure.

The project outline and rubric for those who are interested (note: heavily borrowed from an Internet source that I’m struggling to find at the moment. Update hopefully forthcoming):

Exponent Review Project

Drive or Fly?

Due to two snow days, I had to axe a “Leaving on a Jet Plane” project [full credit to Dan Meyer] where students were going to model flight cost as a function of distance from Detroit. Pretty simple wrap up to linear equations. Now, however, I’m pretty excited it got pushed back since our next stop is systems…

I’m hoping the quick visual I put together will provide a bit of spark and interest. Which circle represents the area where it is cheaper to drive than it is to fly?

fly-or-drive-combo

So now, instead of simply plotting flight cost vs. distance, we’ll also plot driving cost vs. distance, helping us find the answer to the question above. A couple plots, a couple lines of best fit, an intersection representing a break even point and YES YOU CAN USE THIS IN REAL LIFE.

UPDATE #1: Here’s the lab that was whipped together.

Fly or Drive Lab – Word Doc

UPDATE #2:  Next year –

The biggest problem I had was with the data collection. This was a class of 13 8th graders and 10 9th graders. It took much longer to collect data (flight cost & gas cost to each city) than needed. I like having that research in there, but it became far too tedious and drew attention away from what we should have been focusing on. Plus, kids that were absent (whether physically or mentally…) while we walked through how to research the costs fell far behind.

Next year I will crowdsource the data collection. Each student picks one city. Each student researches the cost to fly to their single city and the cost to drive to their single city. I would expect this takes about 15-20 minutes. As they get their data, I’m throwing it into a table that is projected up on the board. Everyone uses the same data, which also allows me to more easily check the lab and make sure the data does what I want (the models intersect at a reasonable distance).

Monopoly, Anyone?

I don’t know why, but during break I found myself playing Monopoly online. Then, somehow I stumbled onto this site:

How to Win at Monopoly® – a Surefire Strategy

Since grading my exams, I’ve been thinking of ways to detach my students from their calculators. Their reaction to any kind of arithmetic is to jump, dive, kick and scream for their calculator. I thought “I’d just like them to play Monopoly for a couple hours and not use their calculators to compute the change.”  Now I have another reason:

The table shows how many opponent rolls it takes, statistically, for a player to break even on their investment in a property. If you go to the site and read the comments, you’ll see many people provide anecdotal confirmation of what the statistics say.  I’m starting to think that this could be a fun way to introduce probability – especially if I can join in on the fun, lay the smackdown, and say “why am I so good at Monopoly?”

The table says that your fastest way to return investment is to throw three houses on the St. James/Tennessee/New York group. This seems to be the kind of thing that students should be able to easily understand why its true:

  • It is not the most expensive color group
  • It is not the cheapest color group
  • It is a second color group (on a board side, meaning it earns higher rents for the same improvement costs)
  • It is 6-9 spaces from Jail.

The last point is the one I can see easily transitioning into probability from.  What is the most often roll of two dice?  Why is that important in Monopoly?  The questions here are endless.

Luckily, I have plenty of versions of Monopoly sitting in a closet in my childhood bedroom. Now I just have to find a way to carve out a day to play Monopoly…